Deserved Goals: Predicting the 2016/17 Season

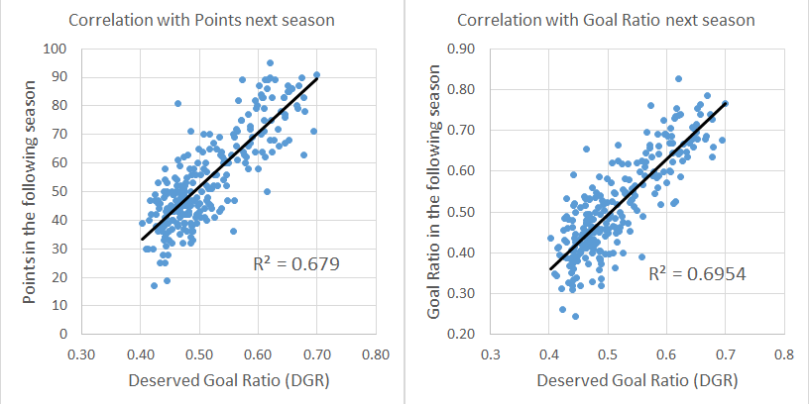
In my last post, I introduced a metric called Deserved Goals Ratio (DGR) for predicting future performance. In this post I use it to predict the 2016/17 season.

For each game in our sample of the last 16 Premier League seasons, we calculate the Deserved Goals Ratio for each team, based on their 38 most recent matches. Taking the Away Team’s ratio away from the Home Team’s ratio gives us a “match rating”.

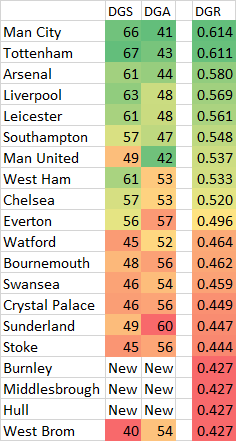
For example, when Leicester played Everton on 7th May 2016, the calculation was as follows:

Leicester: Deserved Goals For: 61, Deserved Goals Against: 47
DGR = 0.56

Everton: Deserved Goals For: 55, Deserved Goals Against: 55
DGR = 0.50

Match Rating = 0.56 – 0.50 = 0.06

If we repeat this calculation for every game over our sample, we can see how match ratings relate to results:

Image1

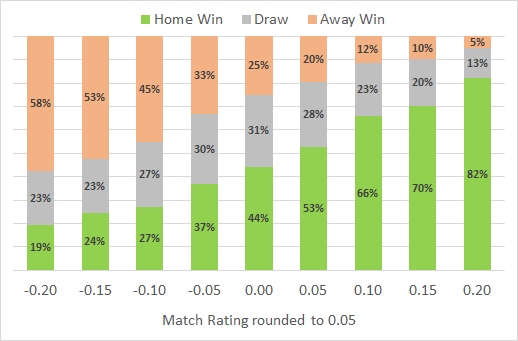
Using Excel’s SLOPE and INTERCEPT functions, we can produce formulas to work out the chances of a Home Win, a Draw or an Away Win for a given match rating.

Home Win % = Match Rating x 1.62 +0.46
Draw % = Match Rating x -0.17 + 0.26
Away Win % = Match Rating x -1.45 + 0.28

For the Leicester vs. Everton example used above, the match rating of 0.06 produces the following probabilities:

Image1

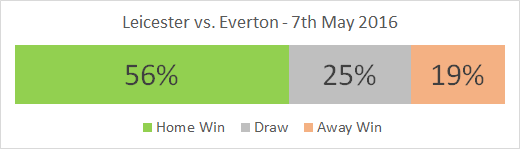
To predict the 2016/17 season, we calculate the DGR for each team, based on their performance in 2015/16. As 3 teams from last year were relegated, we do not have data for the 3 newly promoted teams, namely Burnley, Middlesbrough and Hull City. The average score for the league should be 0.5, so these 3 teams are all given the same score in order to arrive at this average.

Image1

As above, we calculate the match rating and the probabilities for each game. Using a Monte Carlo simulation (which sounds complicated, but just means using random numbers to generate outcomes in proportion to the calculated probabilities for each match), we can see how many points we expect each team to score.

Running 5000 simulations produced the following result, the bars representing the central 90% of the simulations.

Image1

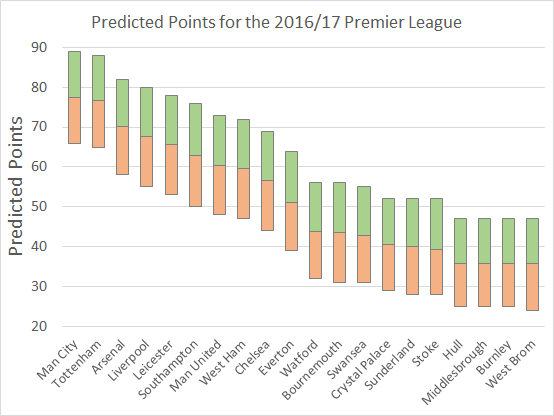
Using the results of the simulations, we can predict how likely it is that each team wins the league.

Image1

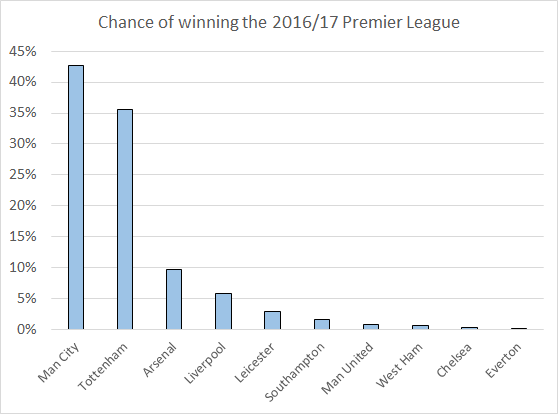
So Deserved Goals expects the title race to be a close fight between Man City and Tottenham, with Man City just having the edge.

A New Metric – Deserved Goals

In a given season of 38 games, we can break down goals scored as follows:

Goals Scored = Shots x Conversion %

Both of these components have an element of skill and an element of luck.

Goals Scored = (Deserved Shots + Effect of luck) x (Deserved Conversion % + Effect of luck)

The effect of luck can be positive or negative, depending on whether a team was lucky or unlucky.

We can add some numbers to this formula, based on statistics from the last 16 Premier League seasons from which we can calculate average shot and conversion rates. We can also calculate how much of the variance from the average is attributable to luck, by calculating how much they regress to the mean between seasons.

What we know:

Average shots taken per season = 453
Average conversion rate = 11.09%
Shots taken above or below average = 80% skill, 20% luck
Shots against above or below average = 81% skill, 19% luck
Conversion % above or below average = 46% skill, 54% luck
Save % above or below average = 40% skill, 60% luck

Adding in those numbers to our formula produces the following:

Goals Scored = (453 + 80% x (Shots – 453) + 20% x (Shots – 453)) x (11.09% + 46% x (Conversion % – 11.09%) + 54% x (Conversion % – 11.09%))

When producing a metric we can use to predict future performance, we cannot predict future luck. We therefore only want to measure the goals produced due to skill, i.e. the Deserved goals.

This is the problem with traditional Goal Ratio, as it includes the luck element along with the skill. Total Shot Ratio is similarly flawed, as it includes the luck in terms of producing shots, and removes finishing skill by assuming a constant conversion rate.

Removing the luck element produces the following formula:

Deserved Goals Scored (DGS) = Deserved Shots x Deserved Conversion %

Or with numbers:

DGS = (453 + 80% x (Shots – 453)) x (11.09% + 46% x (Conversion % – 11.09%))

Using the same method for Deserved Goals Against (DGA), we produce the following:

DGA = (453 + 81% x (Shots – 453)) x (11.09% + 40% x (Conversion % – 11.09%))

We can then produce a Deserved Goals Ratio (DGR) metric, as follows:

Deserved Goals Ratio = DGS / (DGS + DGA)

As this only includes the skill element of shots and conversion %, this metric should be better at predicting future performance than traditional GR or TSR, both of which include past luck and try to use it to predict future skill.

We can test this by looking at how well the metrics for one season correlate with points scored and goal ratio achieved in the following season.

All data is from the last 16 Premier League seasons.

Deserved Goal Ratio (DGR)Image 1

Total Shot Ratio (TSR)
Image 1

Goal Ratio (GR)
Image 1
Conclusion: DGR is better at predicting next season’s performance than GR or TSR.

We can also test within a season, to see how well the metrics so far predict future points at each stage in the season.

correlation


Conclusion: DGR is better at predicting future performance within a season than GR or TSR.

Feedback is much appreciated.

Follow me on Twitter here.

Many thanks go to the work of James W Grayson, 11tegen11 and FootballData.