I’ve built a new model for predicting Premier League results. My aim was to minimise the mean absolute error (MAE) when predicting the result in an individual game. For example, if I predict a that Chelsea will beat Liverpool by 2 goals, but the result is a Liverpool win by 1 goal, the absolute error is 3 goals. Taking an average of all these errors over the same sample of games allows me to compare the accuracy of various models.
As a sample, I’m using Premier League results between 2001/02 and 2016/17. First, let’s establish a benchmark. If we guess that every game will result in a Draw, the mean absolute error (MAE) is 1.348.
If we can’t beat that with our model, we might as well not bother.
Let’s start with a very basic model, the Total Shot Ratio (TSR) from the last 5 games. This is calculated as Shots For / (Shots For + Shots Against), and gives a measure of how much teams are dominating games in terms of shots.
Step 1: Calculate the 5 game TSR for each team, using a few simple assumptions for teams new to the league who have fewer than 5 games.
Step 2: Use Excel’s SLOPE and INTERCEPT functions to convert the difference in TSR between the Home and Away teams into a predicted result for each game.
Step 3: Calculate the absolute error between the prediction and the result for each game.
Result: MAE = 1.276
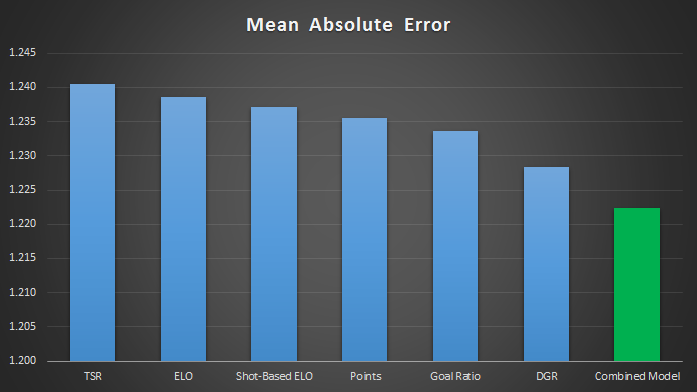
Good news, that’s a decent improvement. However, I know from previous work that using data from 5 games isn’t really enough. To get a true measure of how good teams are, we need to look at a larger sample. A season is 38 games, and taking a rolling 38 game TSR reduces the MAE to 1.240.
Now, looking at shots is all well and good, but again in previous work I have shown that whilst shots are useful when we have limited data to play with, they are pretty poor when we have more than a few games worth of data.
For example, just using the number of Points won in the last 38 games produces a MAE of 1.236. A model that can’t predict better than points is a pretty poor model.
This is where Goals come into play. When we have enough data they are superior to just using shots, because we get an idea of how good the shots are, and how good the teams are at finishing/saving them.
Taking a 38 game Goal Ratio (GR), I get the MAE down to 1.234.
Last year I wrote a few blog posts about a Metric I called Deserved Goal Ratio (DGR), which uses a mix of shots and conversion rates regressed partly to the mean. Using this model improves results again, reducing MAE down to 1.228.
That’s as far as I could get with an individual model, but because different models have different weaknesses, we can often improve predictions by taking an average of different models.
To demonstrate how combining models can work:
38 Game TSR = 1.240
38 Game GR = 1.234
Average of both models = 1.227
Taking an average of the 2 models produces less error than using either model individually, indicating that combining models is the way to go.
In order to combine models easily, I re-scaled each measure to be between 0 and 1, with 0 being the worst team on record and 1 being the best. Then I took an average of the measures from each model.
Combining 38 game TSR, GR, Points and DGR reduces the MAE to 1.224.
Another approach to rating teams is to use an ELO-based system, as used in chess and at Club-ELO. Building a simple ELO model where teams risk 4.6% of their points each game gave me a MAE of 1.239, which is worse than using Points.
However, this approach obviously has some advantages, as when combined with the above models the MAE reduced to 1.223.
Following the ELO theme, I built another model where teams risk 8.2% of their points, but the pot is divided in proportion to the shots taken in the match instead of being awarded to the winner. Again, individually the model was quite poor (MAE = 1.237), but when added to the mix the MAE reduced to 1.222.
My new model is therefore an average of the following:
38 Game Points
38 Game TSR
38 Game GR
38 Game DGR
Standard ELO
Shot-Based ELO
This model produces a Mean Absolute Error of 1.222 when predicting the score of an individual game.

An alternative measure of errors is RMSE, which penalises larger errors more. Which method is best is up for debate, but the Combined Model still comes out on top.

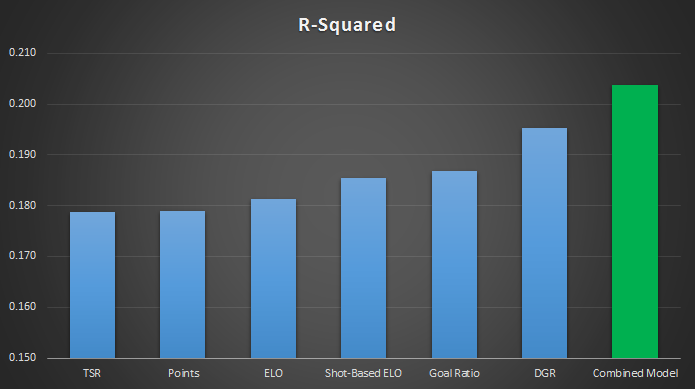
The Combined Model also performs best when using R-Squared, which measures the correlation between the match ratings and the results.

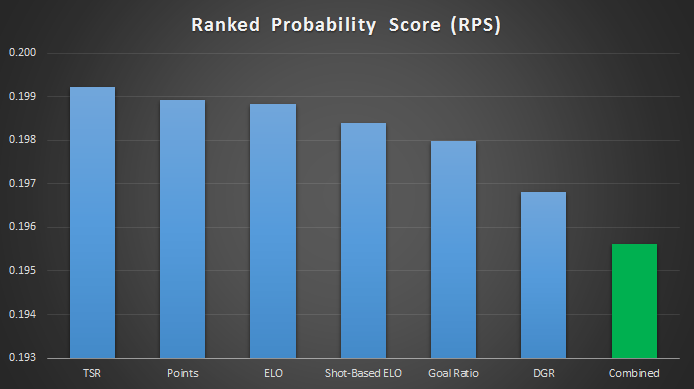
Alex B over at @fussbALEXperte has done some great work recently comparing various public models using a Ranked Probability Score (RPS), which uses the H/D/A probabilities to rate predictions. Using the RPS, the results look very similar.

All very good, I hear you cry. But how does this model compare to other public models?
Since Week 9 of this season, Alex has used the RPS measure to compare a number of models.
The RPS for my model for the first 120 games of this season is 0.1740, which I am told would rank among the top few models. However, 120 games is a small sample, so I will be interested to see how the model gets on for the remainder of the season.