Note: At the time of publishing this post, 16 games have been played. As I began writing this last week when only 14 had been played, this post will ignore the most recent 2 games.
In my last post, I looked at the maximum standard deviation I would expect predictions to have at each stage of the season. In this post, I compare various public models and look at how they have changed over the season.
Unfortunately, there aren’t too many public models which make their weekly predictions easily accessible without trawling through months and months of twitter postings. Steve Jackson at @goalprojection helpfully puts his predictions on his website, and Simon at @analytic_footy published his weekly predictions recently.
Comparing those 2 models to my own, here’s how the SDs have changed over the first 14 weeks of the season.
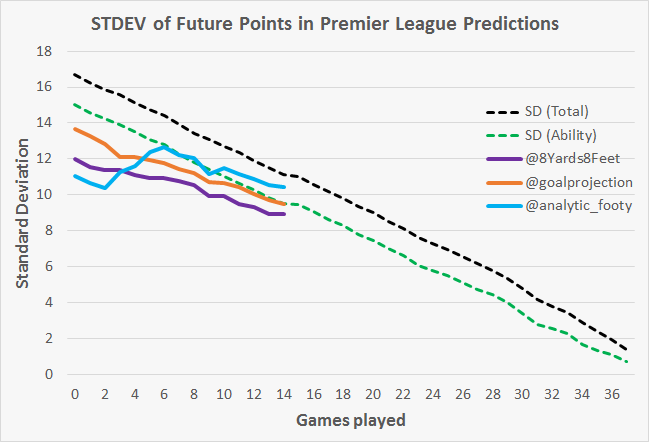
As before, the green line represents the maximum SD I would expect a model to have at each stage of the season. If a model goes above that green line, then there is either a problem with the methodology or the teams this season have a larger spread of ability than normal.
For what it’s worth, despite my model having the lowest SD as this point I’m still uncomfortable with it being that high. I don’t think that we can realistically claim to know enough about how well each team will do to justify such a high SD.
Whilst I haven’t yet collected together the weekly predictions, I know that @Goalimpact‘s model had much lower SD of around 4.5 a couple of weeks ago, which I think is probably more realistic.
Interestingly, @analytic_footy‘s predictions started out with the lowest SD, but increased sharply after week 2 and crept over the green line from about week 10. The SD after 14 games is very similar to what it was at the start of the season, meaning Simon expects there to be as much variance in just the next 24 games as he expected there to be in the whole 38 games at the start of the season. That’s a big change, which is because he believes there is a wider spread in team ability this year than average, which presumably wasn’t obvious at the start of the season.
In a future post, I want to look at whether that belief can be justified, and how easily we can predict the SD for games 14 to 38 based on data from the first 13 games.
Feedback is much appreciated. Also, if you have a model which you want adding to this post please let me know and I will update the graph.
