Standard Deviation and Predicting the Premier League

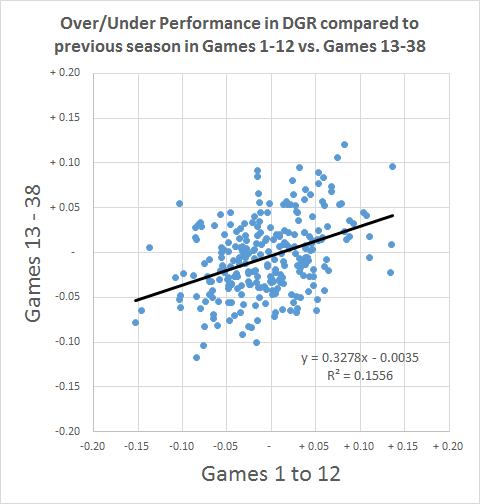
Phil Birnbaum wrote a blog piece back in 2014 about how the spread of points in predictions should always be narrower than the spread of points in real life.

Put simply, this is because the spread of points is influenced by 2 factors:

  1. The different abilities of the teams
  2. Which teams get lucky or unlucky

We can’t predict which teams will be lucky, so we can only hope to predict the spread of points which is caused by their differing abilities. As this will be less than the total spread of points, predictions should always be narrower than real life.

“How much narrower?”, I hear you cry. Well, thankfully there is a mathematical equation which helps us to determine that.

SD(total)^2 = SD(ability)^2 + SD(luck)^2

SD stand for Standard Deviation, which is a mathematical measure of how spread out the points are. In Excel you can easily calculate the SD for a set of numbers using the STDEV() function.

As we are trying to calculate the SD attributable to ability, let’s rearrange this formula and start filling in what we know.

SD(ability) = SquareRoot ( SD(total)^2 – SD(luck)^2 )

First of all then, let’s look at the total spread of points. We can do this by looking at the SD of points scored in previous seasons.

stdev

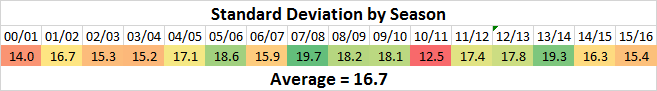
So there’s quite a range, from 12.5 in 2010/11 to 19.7 in 2007/08.

On average, the total SD in a season is 16.7.

Let’s add that to our formula:

SD(ability) = SquareRoot ( 16.7^2 – SD(luck)^2 )

SD(ability) = SquareRoot ( 278.9 – SD(luck)^2 )

So, what about the luck? How do we start to calculate that?

Neil Charles estimated it here to be around 7.4.

Using the model I built for my previous posts on the natural limits of predictions (Part 1 and Part 2), I calculate a figure of 7.1. Using a model based on betting odds, I arrive at a figure of 7.4.

These models run lots of simulations of a league with a spread of ability similar to the premier league, using H/D/A percentages derived either from historical data or betting odds, and look at the range of points that can arise. As the abilities are the same in each simulation, any variation which emerges is entirely due to luck.

As these models all produce very similar figures, let’s take 7.4 and plug it into our formula.

SD(ability) = SquareRoot ( 278.9 – 7.4^2 )

SD(ability) = SquareRoot ( 278.9 – 54.8 )

SD(ability) = SquareRoot ( 224.1 )

SD(ability) = 15.0

Finally, an answer.

This means that for predictions made at the start of a season, 15.0 is the maximum SD we would expect to see, if a model had perfect knowledge of the ability of each team. Anything more than that is probably trying to predict which teams will be lucky, which is impossible.

The SD can be seen as a measure of confidence. A low SD is an acceptance that you can’t accurately measure the abilities of the teams. A high SD shows that you are confident about the accuracy of your model. If your SD breaks the maximum, there is probably something wrong with your methodology.

So, that’s all very good for pre-season predictions. But what about predictions part way through the season? We have had 13 games played already, what sort of SD should we expect for future points at this stage?

We can use the same method to calculate the maximum SD after each game, when predicting points scored in the remainder of the season. This produces the following:

Standard Deviation.png

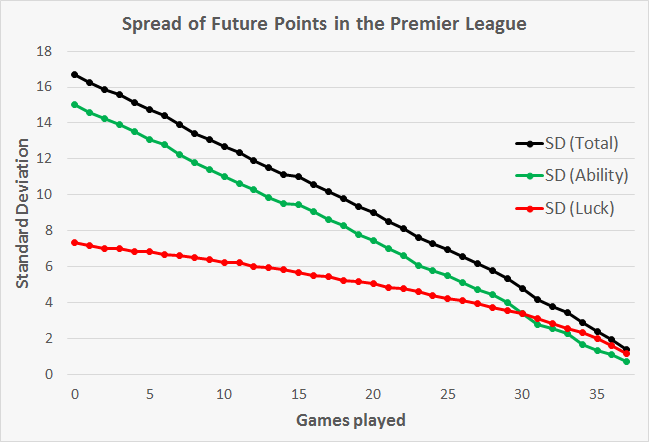
The green line here represents the maximum SD we would expect a prediction to have at each stage in the season.

With 13 games played, the maximum SD value should be 9.9.

To calculate the SD of a prediction, we do the following:

1) Take the predicted final point tallies for each team
2) Deduct the number of points each team already has to get the predicted future points
3) Use the STDEV() formula on Excel on the predicted future points

To start with, let’s look at my own predictions:

predictions

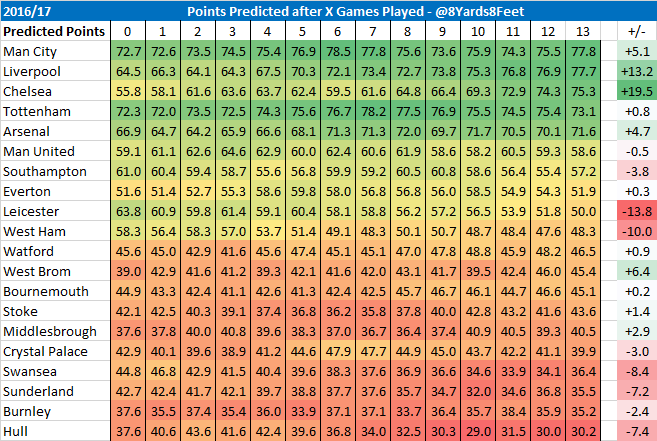
Using the above method, I deduct points already scored from each week’s predictions, and then calculate the SD of the future points at each stage.

This results in the following:

8y8f

Good news, my model has remained below the green line, which represents the average maximum predictable variance.

There are 2 reasons a model might go above the line:

  1. There is a problem with the methodology
  2. This season has a larger spread of points than average

In my next post I will look at other public models to see how they compare, and try establish whether this season has a larger spread of abilities than the average season.

Much of the above methodology comes from this post by James Grayson, whose blog is well worth a read.

As ever, feedback is much appreciated.

Why Leicester will (probably) finish in the top half

Leicester, the surprise champions of the league last season, currently find themselves down in 14th place after 12 games.

Last year, Leicester’s Deserved Goal Ratio (DGR) was 0.562, the 5th best in the league. With average luck, I would have expected this to translate into 65 points. In fact, they won 81 points, an over-performance of 25%.

Now DGR isn’t a perfect metric, and although it is better than other metrics at predicting performance there are elements of football that it doesn’t take into account. However, for the purpose of this blog let’s assume that DGR is a perfect way of measuring team skill.

Making this obviously incorrect but easy assumption, we can say that Leicester’s over-performance last season was sheer luck. Leicester should have got 65 points and finished 5th, but they got lucky and managed to win the league.

Based on this, coming into this season all I could do was expect Leicester to have average luck and win points in relation to their underlying skill. As most teams regress towards the mean a little bit between seasons, I expected Leicester to achieve around 63 points in 2016/17.

Assuming they won these points evenly over the season, after 12 games I would have expected them to have roughly 20 points. In fact, they have only 12.

Theory 1: They are still the same Leicester as last year

Maybe they have just been unlucky so far, and they are just as good as last season. If we expect them to have average luck from now on, they would achieve a score of 55 points, having already dropped 8 points from their expected total.

Theory 1 Prediction: 55 points.

Theory 2: They are much worse than last year

Maybe they haven’t scored many points because their performance has been genuinely poor this season. Let’s assume this season’s stats are representative of their new true level of ability.

So far this season, Leicester’s stats per game are as follows (previous season in brackets):

Shots for: 10.58 (13.76)
Goals for: 1.17 (1.79)
Conversion rate for: 11.0% (13.0%)

Shots against: 14.08 (13.58)
Goals against: 1.67 (0.95)
Conversion rate against: 11.8% (6.98%)

Deserved Goals for: 1.19 (1.58)
Deserved Goals against: 1.53 (1.22)
DGR: 0.437 (0.562)

The first thing to note is that Leicester’s underlying stats have all got worse compared to last season. They are taking fewer shots, and converting fewer of these shots into goals. Also, their opponents are taking more shots, more of which are going into Leicester’s net.

A DGR of 0.437 translates to 27 points in the rest of the season, which when added to the 12 they already have gives them a final total of 39 points.

Theory 2 Prediction: 39 points

Looking at the data

Before we can make this gloomy conclusion we need to look at whether a team’s performance after 12 games is a good indicator that a team’s ability has changed. If it is, we should expect the over/under performance so far compared to last season to continue in games 3-38.

Newsflash: It doesn’t.

over-under

OK, so it does to some extent. But it’s not a very strong relationship, and on average the over/under performance after 12 games falls away by about two thirds in the remainder of the season.

This is good news for Leicester. Their under performance so far of 0.125 DGR should reduce to an under performance of 0.044 DGR in games 13 to 38.

Our best guess of Leicester’s actual DGR for the remainder of the season is therefore 0.518 (0.562 – 0.044). This translates to 38 points in the rest of the season, meaning my best prediction is a final total of 50 points.

In summary then:

Original pre-season prediction: 63 points

Theory 1; Optimistic: 55 points

Theory 2; Pessimistic: 39 points

Looking at the data: 50 points

Nobody really expected Leicester to repeat last season’s result, as they over performed their underlying stats in a way that probably wasn’t sustainable. Their terrible start this season is evidence of a slight decline, but based on historical trends we should expect their stats to pick up quite a bit in the rest of the season. They won’t be winning the league, but they shouldn’t be anywhere near relegation either.

Of course, when predicting points you also need to consider the strength of the other teams in the league. My weekly predictions on Twitter do this, and at the moment I have Leicester predicted to win 52 points, and finish 9th.

Feedback is appreciated.