Deserved Goals 2.1

In my last post (which I recommend you read before this), I improved my original Deserved Goals model, which resulted in the following formula:

Deserved Goals 2.0 = (( Average Shots+ A% of the variance ) x ( Average Combined xG per Shot + B% of the variance )) x ( Average Goals per Combined xG + C% of the variance )

I estimated figures for A, B and C, and showed that in-sample, it performed well against other metrics at predicting the Premier League.

However, there are a number of issues with this approach. Firstly, to properly test a metric it is important to separate your data into “training” and “testing”. You should only use the training data to develop the metric, and then you should test it on the unseen testing data to see how it performs. Also, a metric should be able to perform well in other top leagues, not just the Premier League.

I have therefore widened the scope to encompass the top 5 European leagues (England, Spain, Germany, France and Italy), and split the data as follows:

Training Data: 2016/17 & 2017/18, a total of 3652 games

Testing Data: 2018/19, a total of 1,826 games

Ignoring the testing data for now, I will develop the metric using only information from the training data.

To do this I need to find values for the following variables. These need to work well in the training data, have some basis in theory, and be general enough to avoid over-fitting.

Deserved Goals = (( Average Shots+ A% of the variance ) x ( Average Combined xG per Shot + B% of the variance )) x ( Average Goals per Shot Based xG + C% of the variance )

Let’s work through these one at a time.

Average Shots is easy, as we can just see what the average number of shots taken by a team was in our training data. There were 90,858 shots taken in 3,652 games, with 2 teams in each game, which is 12.4 shots per game per team.

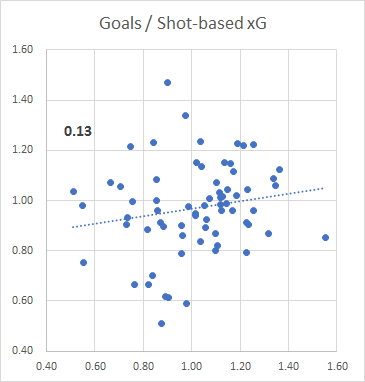
Average Combined xG per Shot should theoretically be the same as the average conversion rate (assuming xG accurately reflects the chance of a goal being scored). In the training data, there were 10,121 goals scored from 90,858 shots, which is a conversion rate of 11.1%.

Average Goals per Shot Based xG should theoretically be 100%, again assuming xG is a good measure of the chance of a goal being scored.

Filling in those figures gives the following:

Deserved Goals = (( 12.4 + A% of the variance in shots) x ( 11.1% + B% of the variance in Combined xG per Shot )) x ( 100% + C% of the variance in Goals per xG)

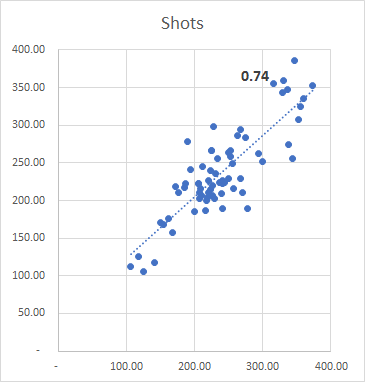
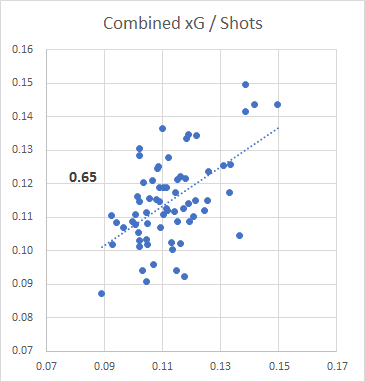
As for A, B and C, we need to look at how these 3 components regress to the mean within a season. Again, we will only use the training data.

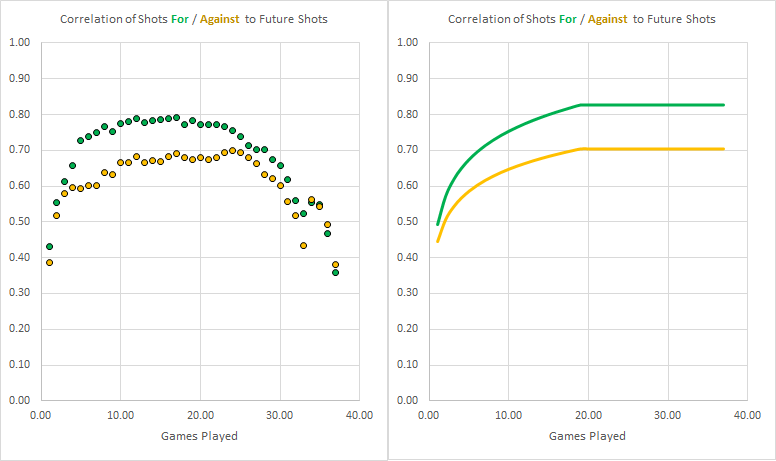
Let’s start with Shots. In the charts below, on the left is the correlation between the shot rate at each stage in the season, and the shot rate in future games, for both Shots For and Shots Against. We can see that Shots For are more repeatable, indicating that taking shots is more of a skill than not allowing your opponent to take shots. This tells me that to get better predictions, I need to have different input values for Attack and Defence.

The other thing to notice is that the data is noisy. This reflects what actually happened in the training data, but if we want it to actually tell us something about football we need to look at the trend.

The right hand side shows the trend I will use in my metric. For the first half of the season (19 games), I have plotted a logarithmic trend line. I have then fixed the value at the value after 19 games for the remainder of the season. This is because I believe the drop off in correlation reflects the diminishing number of games remaining, not an actual drop off in predictive power.

Shot Correl

Put simply then, the value for A will vary depending on how many games have been played. This is because after a few games we are much less sure that the variation reflects ability rather than luck than we are after a larger number of games.

Repeating this for the other components produces these results, which will be the inputs for A, B and C.

Correls

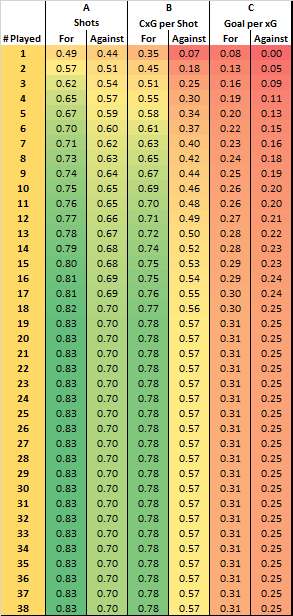
For all 3 components, it seems like it is easier to rate Attack than Defence. Using these values should improve predictions, as we will regress defensive statistics towards the mean more than the attacking statistics.

OK, so this is the new form of the metric (v2.1), which uses the figures we calculated and the inputs from the above chart:

Deserved Goals For = (( 12.4 + A% of the variance in shots for) x ( 11.1% + B% of the variance in Combined xG per Shot for)) x ( 100% + C% of the variance in Goals per xG for)

Deserved Goals Against= (( 12.4 + A% of the variance in shots against) x ( 11.1% + B% of the variance in Combined xG per Shot against)) x ( 100% + C% of the variance in Goals per xG against)

Deserved Goals Ratio = Deserved Goals For / (Deserved Goals For + Deserved Goals Against)

Now we have a metric, it’s time to work out the relationship between the metric and future points, again only using the training data. Using the Slope and Intercept functions in Excel for each week of the season, and taking an average of results of the middle 11 games where the values should be more stable, I get the following formula:

Future Points per Game = (4.48 x Deserved Goals Ratio) – 0.88

As a quick sense check, the average team should have a ratio of around 0.500.

4.48 x 0.500 – 0.88 = 1.36 points per game

1.36 points per game over a 38 game season is around 52 points, which is about right for an average team.

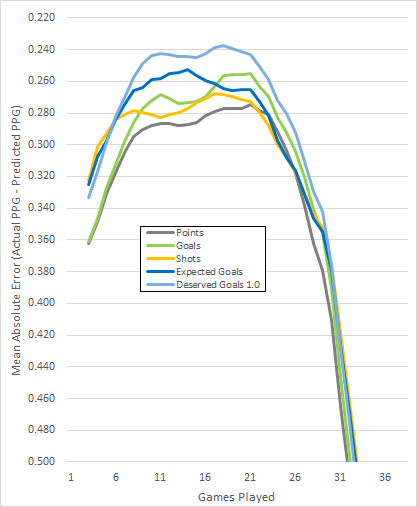
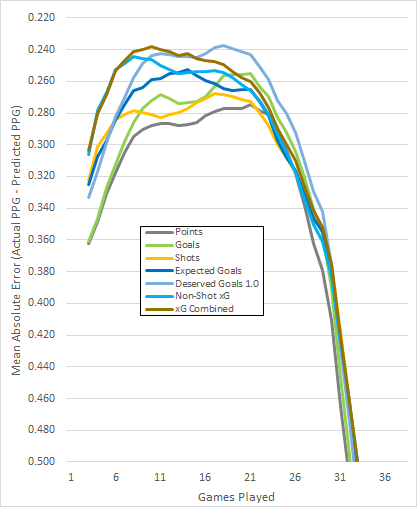
OK, so we have arrived at a complete model. Here are the results for each metric within the training data:

Training Results

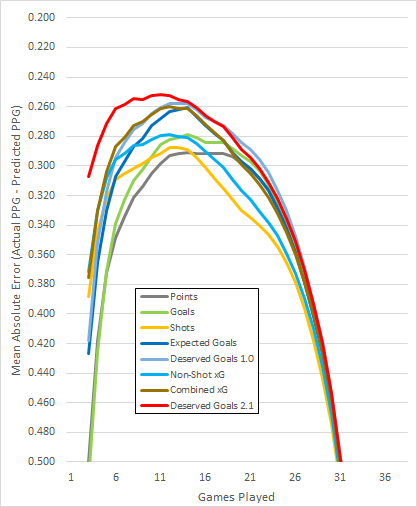
As expected, the model does well within the training data. However, the real test is to see how it gets on with the testing data, which it hasn’t seen yet.

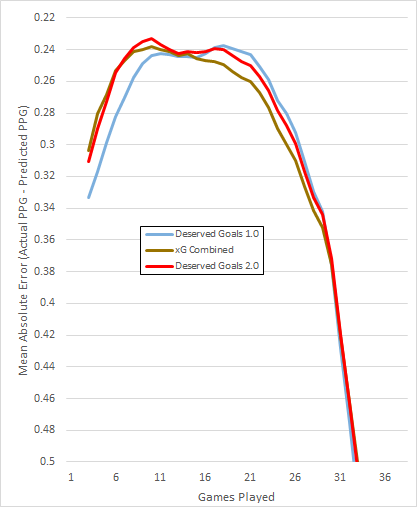
Here are the results with the testing data:

Testing Results.png

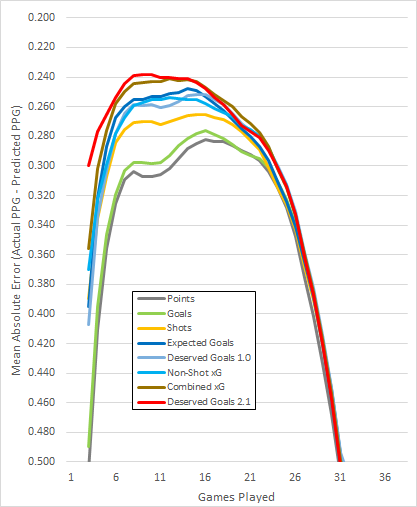
Whilst the difference is not as large as in the training data, Deserved Goals 2.1 still races into an early lead, and is the best overall metric.

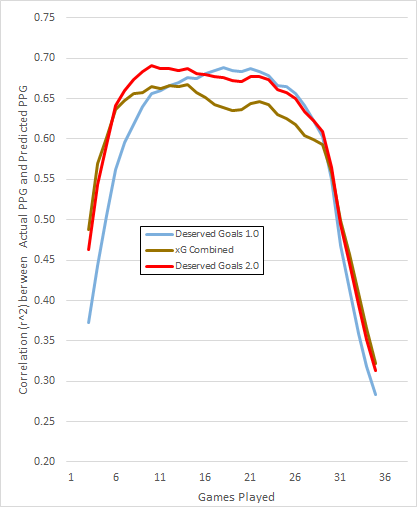
Looking at correlation instead of average errors, we get a similar picture in the testing data:

Correl Testing

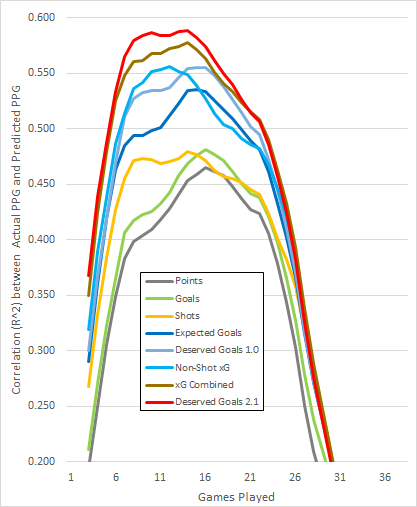
This is an encouraging result, and shows that Deserved Goals 2.1 would be a good metric to choose when trying to predict future performance in top level club football.

If you have any questions, comments or suggestions, please let me know. I am on Twitter @8Yards8Feet

Data from: http://www.football-data.co.uk/  and https://projects.fivethirtyeight.com/soccer-predictions/

Deserved Goals 2.0

Back in 2016, I introduced a new metric called Deserved Goals. This was an attempt to quantify the underlying skill of Premier League teams, and develop better predictions than the existing metrics.

I was pretty happy with it, and I have had some success using the metric to predict the Premier League, especially when combining it with other metrics. However, 3 years later I think I can make some improvements.

The original Deserved Goals used the number of shots taken by a team and their conversion rate of shots into goals, regressed towards the average. For shots taken, I kept 80% of the variance from the average, and for conversion rate I kept 46% of the variance.

Deserved Goals = ( Average Shots + 80% of the variance ) x ( Average Conversion + 46% of the variance )

I calculated 453 as being the average number of shots taken in a season, and 11.09% being the average conversion rate.

Deserved Goals = (453 + 80% x (Shots – 453)) x (11.09% + 46% x (Conversion Rate – 11.09%))

So a team which took 500 shots in a season and scored 70 goals, which is a 14% conversion rate, would have a Deserved Goals score of 61 goals.

Deserved Goals = (453 + 80% x (500-453)) x (11.09% + 46% x (14%-11.09%))

Deserved Goals = (453 + 80% x 47) x (11.09% + 46% x 2.91%)

Deserved Goals = (453 + 37.6) x (11.09% + 1.34%)

Deserved Goals = 490.6 x 12.43%

Deserved Goals = 61 goals

We would therefore expect 61 goals per season to be a better reflection of this team’s underlying attacking strength than the 70 goals they actually scored.

You can do the same calculation for goals against, work out a ratio, and use this as a metric.

Before we can start improving it, we need to quantify how good the original metric was. Using data from the 16/17, 17/18 and 18/19 Premier League seasons, we can see how well various metrics do at predicting future performance within a season.

Note: As the data is a bit messy, I have plotted a 5 point centred moving average to make things easier to interpret on all of the following charts. Also, higher is better on all charts.

Here are the results for the average errors (MAE) between predicted and actual future points per game (PPG) for each metric.

Errors

So, Deserved Goals 1.0 was pretty good. It picked up a signal quickly, and outperformed the other metrics (including Expected Goals) for the majority of the season.

Since I wrote my original blog post, a number of things have changed. Firstly, data for Expected Goals (xG) is now freely available from a number of sources. I have used FiveThirtyEight’s data for the above chart. This data was not available a few years ago.

Secondly, a second form of xG has been developed, called non-shot xG. Rather than using shots, it gives an xG value to each period of possession, meaning you get more meaningful data points quicker than using shot-based xG. Theoretically, this should give better predictions earlier in the season.

Indeed, this is what we see when we plot the non-shot xG on the chart.

Errors2

Non-Shot xG is a much better predictor than any other metric early in the season, although it is still not as good as Deserved Goals 1.0 in the latter 2 thirds of the season.

Combining the 2 versions of xG is even more powerful. Simply taking an average of the Shot-based and Non-Shot xG figures improves performance, as seen below. This will be referred to as Combined xG.

Errors3

OK, so now we’ve set the challenge to beat. I want Deserved Goals 2.0 to be as powerful in the early season as Combined xG, and I want to keep the strong performance in the second half of the season.

Here’s my thought process. The original formula was as follows:

Deserved Goals 1.0 = ( Average Shots + A% of the variance ) x ( Average Conversion + B% of the variance )

I still want to use shots as the starting point, and so the initial part of the formula remains unchanged. This gives us an estimate of how good a team is at creating shooting opportunities.

( Average Shots + A% of the variance )

I want to improve early season performance by using Combined xG, so next up is an adjustment to account for how good these shots are predicted to be. For this let’s use Combined xG divided by the number of shots, for which the average will be the same as the average conversion, 11.09%. As with all parts of the formula, we will only keep a percentage of the variance from the average. This gives us an estimate of how good a team is at ensuring their shots are taken from good locations:

( Average Combined xG per shot + B% of the variance )

We then have the old conversion rate, but rather than using shots we are using Shot-based xG, so this becomes the conversion of Expected Goals into goals, which on average should be 100%. This gives us an estimate of how good a team is at converting shots into goals, controlled for the quality of the chance. You might call this finishing skill:

( Average Goals per Shot-based xG + C% of the variance )


The formula is therefore:

Deserved Goals 2.0 = (( Average Shots + A% of the variance ) x ( Average Combined xG per Shot + B% of the variance )) x ( Average Goals per Shot based xG + C% of the variance )

I need to select values for A, B and C. These should be a good approximation of the extent to which the 3 components are skill rather than luck. In other words, how much of the variance from the average is signal rather than noise. We would expect the ability to create shots to be mostly signal, whereas finishing skill is notoriously “noisy”, so we would expect a low %.

To get a rough idea of what these should be, I have calculated how much these 3 components revert to the mean between seasons, using Pearson’s R (The CORREL function in Excel).

Here are the results:

shots

shots

shots

So, just using these figures would mean A=74%, B=65% and C=13%. That’s a good starting point, however looking at season-to-season correlations is a bit misleading. Teams often change personnel between seasons, so I would expect the correlations to be higher than this within a season where personnel stays mostly the same.

Let’s increase each figure a bit, to A=90%, B=75%, and C=25%, and see how the metric performs.

The final formula is therefore:

Deserved Goals 2.0 = (( Average Shots+ 90% of the variance ) x ( Average Combined xG per Shot + 75% of the variance )) x ( Average Goals per Shot-Based xG + 25% of the variance )

or:

Deserved Goals = ((453 + 90% x (Shots – 453)) x (11.09% + 75% x (Combined xG per Shot – 11.09%))) x ( 100% + 25% x (Average Goals per Shot-Based xG – 100%))

OK, so let’s see how this metric gets on.

Previously the best 2 metrics were Combined xG and Deserved Goals 1.0. Here’s how Deserved Goals 2.0 compares to those:

shots

I’m classing that as a success. Deserved Goals 2.0 is much better than the original version in the early part of the season, and is on a par with Combined xG. In the latter stages it outperforms Combines xG, and is almost as good as the original version. Overall, it is the best metric of all the ones I have tested so far.

I could probably tweak the values of A, B and C to improve the results, but I think there would be a risk of over-fitting to the data.

Another way of measuring the performance of predictive metrics is to use r^2 instead of average errors. This produces similar results:

correl2

If you enjoyed this post, please see part 2 here, where I develop this further.

If you have any questions, comments or suggestions, please let me know. I am on Twitter @8Yards8Feet

Data from: http://www.football-data.co.uk/ and https://projects.fivethirtyeight.com/soccer-predictions/