In this blog I look in detail at the predictive power of various metrics in the Premier League, to see which is best at predicting future performance at each stage of the season.
The metrics I am testing are as follows:
PTS = Points scored
TSR = Total Shot Ratio
SOTR = Shots on Target Ratio
GR = Goal Ratio
DGR = Deserved Goals Ratio
Test 1
For the first test, I want to imagine that we know nothing about each team at the start of the season.
Using data from the last 15 seasons, I will see how well each metric predicts points scored in the remaining fixtures. For example, after 10 games played I will see how well the metrics for the first 10 games predict points scored in games 11 to 38.
Note: To be consistent with a test I will perform later in the post, I am just looking at the 17 teams in each season who played in the season before. That means that the sample is 17*15, so 255 full seasons.
There are 2 methods of testing predictive power. The first is looking at the correlation (R^2), and the second is looking at the average errors (MAE). Let’s start with correlation, where higher numbers are better.
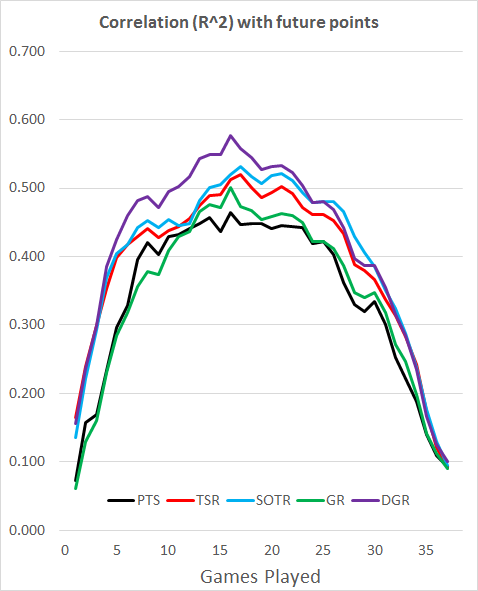
So, if we don’t know anything about the teams at the start of the season, this test would indicate that we should use DGR for the majority of the season, although SOTR takes the lead briefly between 26 and 29 games played. TSR is slightly worse than SOTR pretty much all season, and PTS and GR start off badly and never catch up with the rest.
Whilst using R^2 to test predictive power is widespread, a better test is to look at the average error per game when using each metric to predict future points.
To make the graph easier to interpret, I have shown the results relative to the results for PTS. On this graph, low is good.
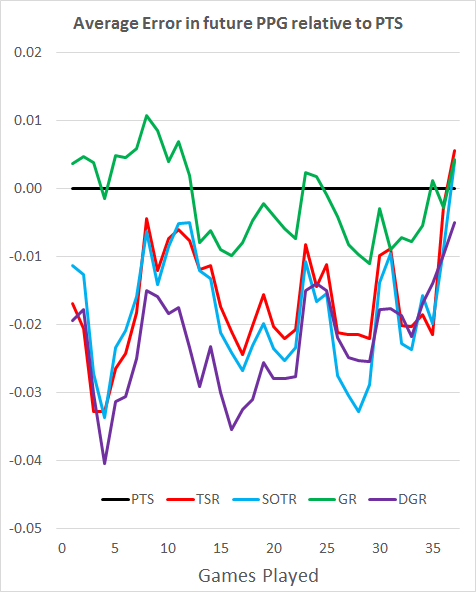
We can see from this that the average errors agree with the R^2 results. DGR still dominates for most of the season, SOTR takes the lead for a brief period etc.
However, there is a problem with this approach. We don’t start the season knowing nothing about the teams.
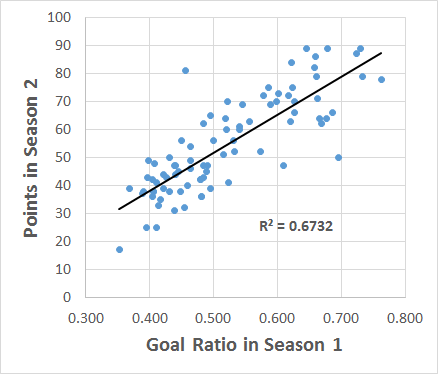
Goal Ratio gets a bad result in the above test, but as examined in a previous post we know that GR in one season correlates more with points in the following season than TSR, so it must have some decent predictive power with a larger sample.
Test 2
Let’s repeat the above test, but instead of assuming we know nothing at the start of the season, let’s be more realistic and start off with the previous season’s data, and then use a 38-game rolling score as the teams progress through the season.
Here’s the R^2 results, with our previous results greyed out for comparison. High is good.
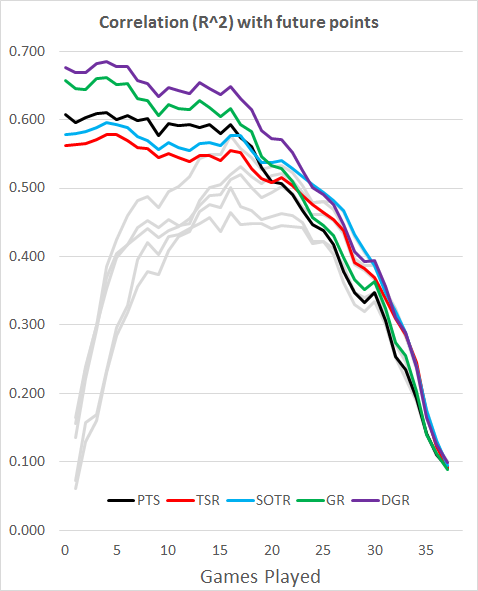
Obviously, our early season results are much better. In addition, the previously poor GR redeems itself, being a better early season predictor than both shot-based metrics, which fall behind PTS in the same period. DGR still dominates, and SOTR still takes a brief lead later on. Importantly, almost all these results are better than just using in-season data.
Again, I’ve done the average errors test relative to the results for PTS. Low is good.
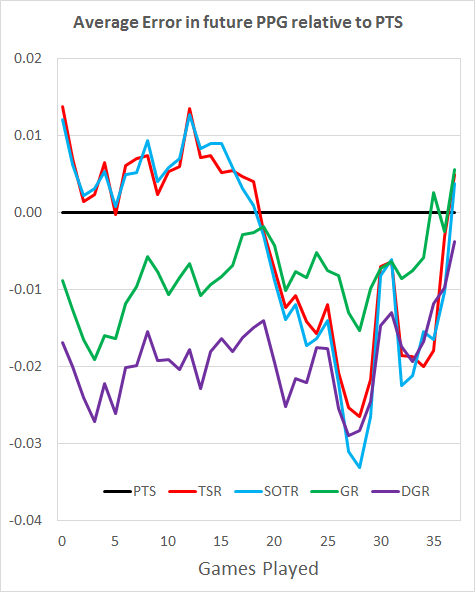
Once more, this tells a similar story to the R^2 values. DGR takes an early lead over GR, and is overtaken by SOTR for a brief period. The later stages of the season are a mix of DGR and the shot-based metrics.
In summary then, DGR is the best early-season predictor, both when limited to in-season data and when using data from the previous season. SOTR is a good metric for the later stages, although DGR does well here too. GR is a strong metric, but only worth using with access to results from the previous season, as it takes too long to pick up a signal within a season.
Full results are available on google sheets here: Google Sheets Results.
To finish off, what does this mean for the current season?
Well, with 6 games played, a rolling 38 game Deserved Goals Ratio has a higher correlation and lower average error than any other metric tested here. If you can’t be bothered to calculate that, a rolling 38 game Goal Ratio is not far behind.
If you insist on only looking at this season, DGR is still the best after 6 games, followed by Shots on Target Ratio. However, these in-season metrics are significantly worse than longer-term approaches, so it’s worth the time looking a bit further back for information about the relative strength of the teams.
As an example, Points scored in the first 6 games correlates with points scored in games 7-38 with an r^2 of 0.329, and an average error of 0.296.
38-game DGR after the first 6 games correlates with an r^2 of 0.670, and an average error of 0.202.
Follow me on Twitter @8Yards8Feet
The idea for these graphs comes from 11tegen11, whose blog is well worth a read.